Activity 1#
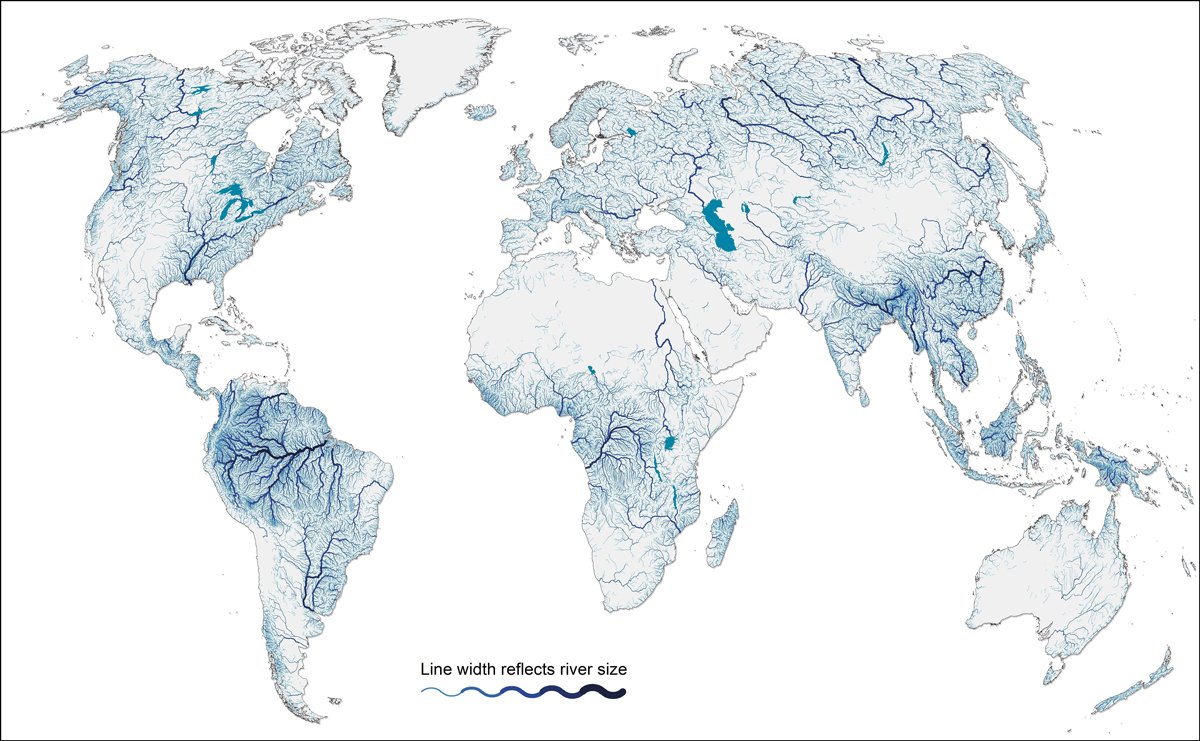
Download the data for the assignment from here. This dataset contains attributes for the some of the largest rivers in the world. In this activity, we will use the pandas package to do some basic analysis on this dataset.
Activate the
.gdsPython environment by opening an Anaconda Prompt (miniconda3) (Windows) or Terminal (macOS). Then, on Windows:
.gds\Scripts\activate
Or, on macOS:
source .gds/bin/activate
Note
Make sure you run this command from the same directory as the .gds environment folder.
Open a Jupyter Notebook by running:
jupyter notebook
Note
If you run this command from your course folder, your .ipynb assignment will automatically be saved there.
Task 1 (5 points)#
Import the
pandaspackage (i.e.import pandas as pd) and read the data (i.e.pd.read_csv)
Write some code that prints the following information:
Number of columns
Number of rows
The maximum
Average discharge (m3/s)valueThe minimum
Drainage area (km2)valueThe mean
Length (km)value
Task 2 (5 points)#
Answer the following questions:
What is the name of the shortest river?
How many of these rivers are located in North America?
What is the mean and standard deviation of
Average discharge (m3/s)(of entire DataFrame)?What are the names of the rivers that flow into the Atlantic Ocean?
Which continent contains the most large rivers?
Task 3 (5 points)#
Add a column called
Primarythat has value of1if the riverTypeisPrimary Riverand0if the river is aTributary River.Make a new DataFrame of just the
Primaryrivers.Write a
forloop that prints the name of each river in this new DataFrame.Write another
forloop that only prints the name of the river if it starts with the letterM.Modify the
forloop so it saves the names of these rivers as alist.
Important
Save your notebook locally in both .ipynb and .pdf formats but only submit the pdf to Canvas.