Assignment 4#
Download the land cover data for this assignment from here. The datasets are two National Land Cover Database (NLCD) products for Phoenix, AZ from 2001 and 2019. More information about the data can be found on the Multi-Resolution Land Characteristics Consortium wesbite.
Task 1 (5 points)#
a) How many rows and columns are there in the
nlcd_2001_phoenix.tifGeoTIFF?b) List the northernmost, southernmost, eastermost, and westernmost coordinates of the dataset.
c) Plot the land cover data for 2001 using qualitative colormap of your choice.
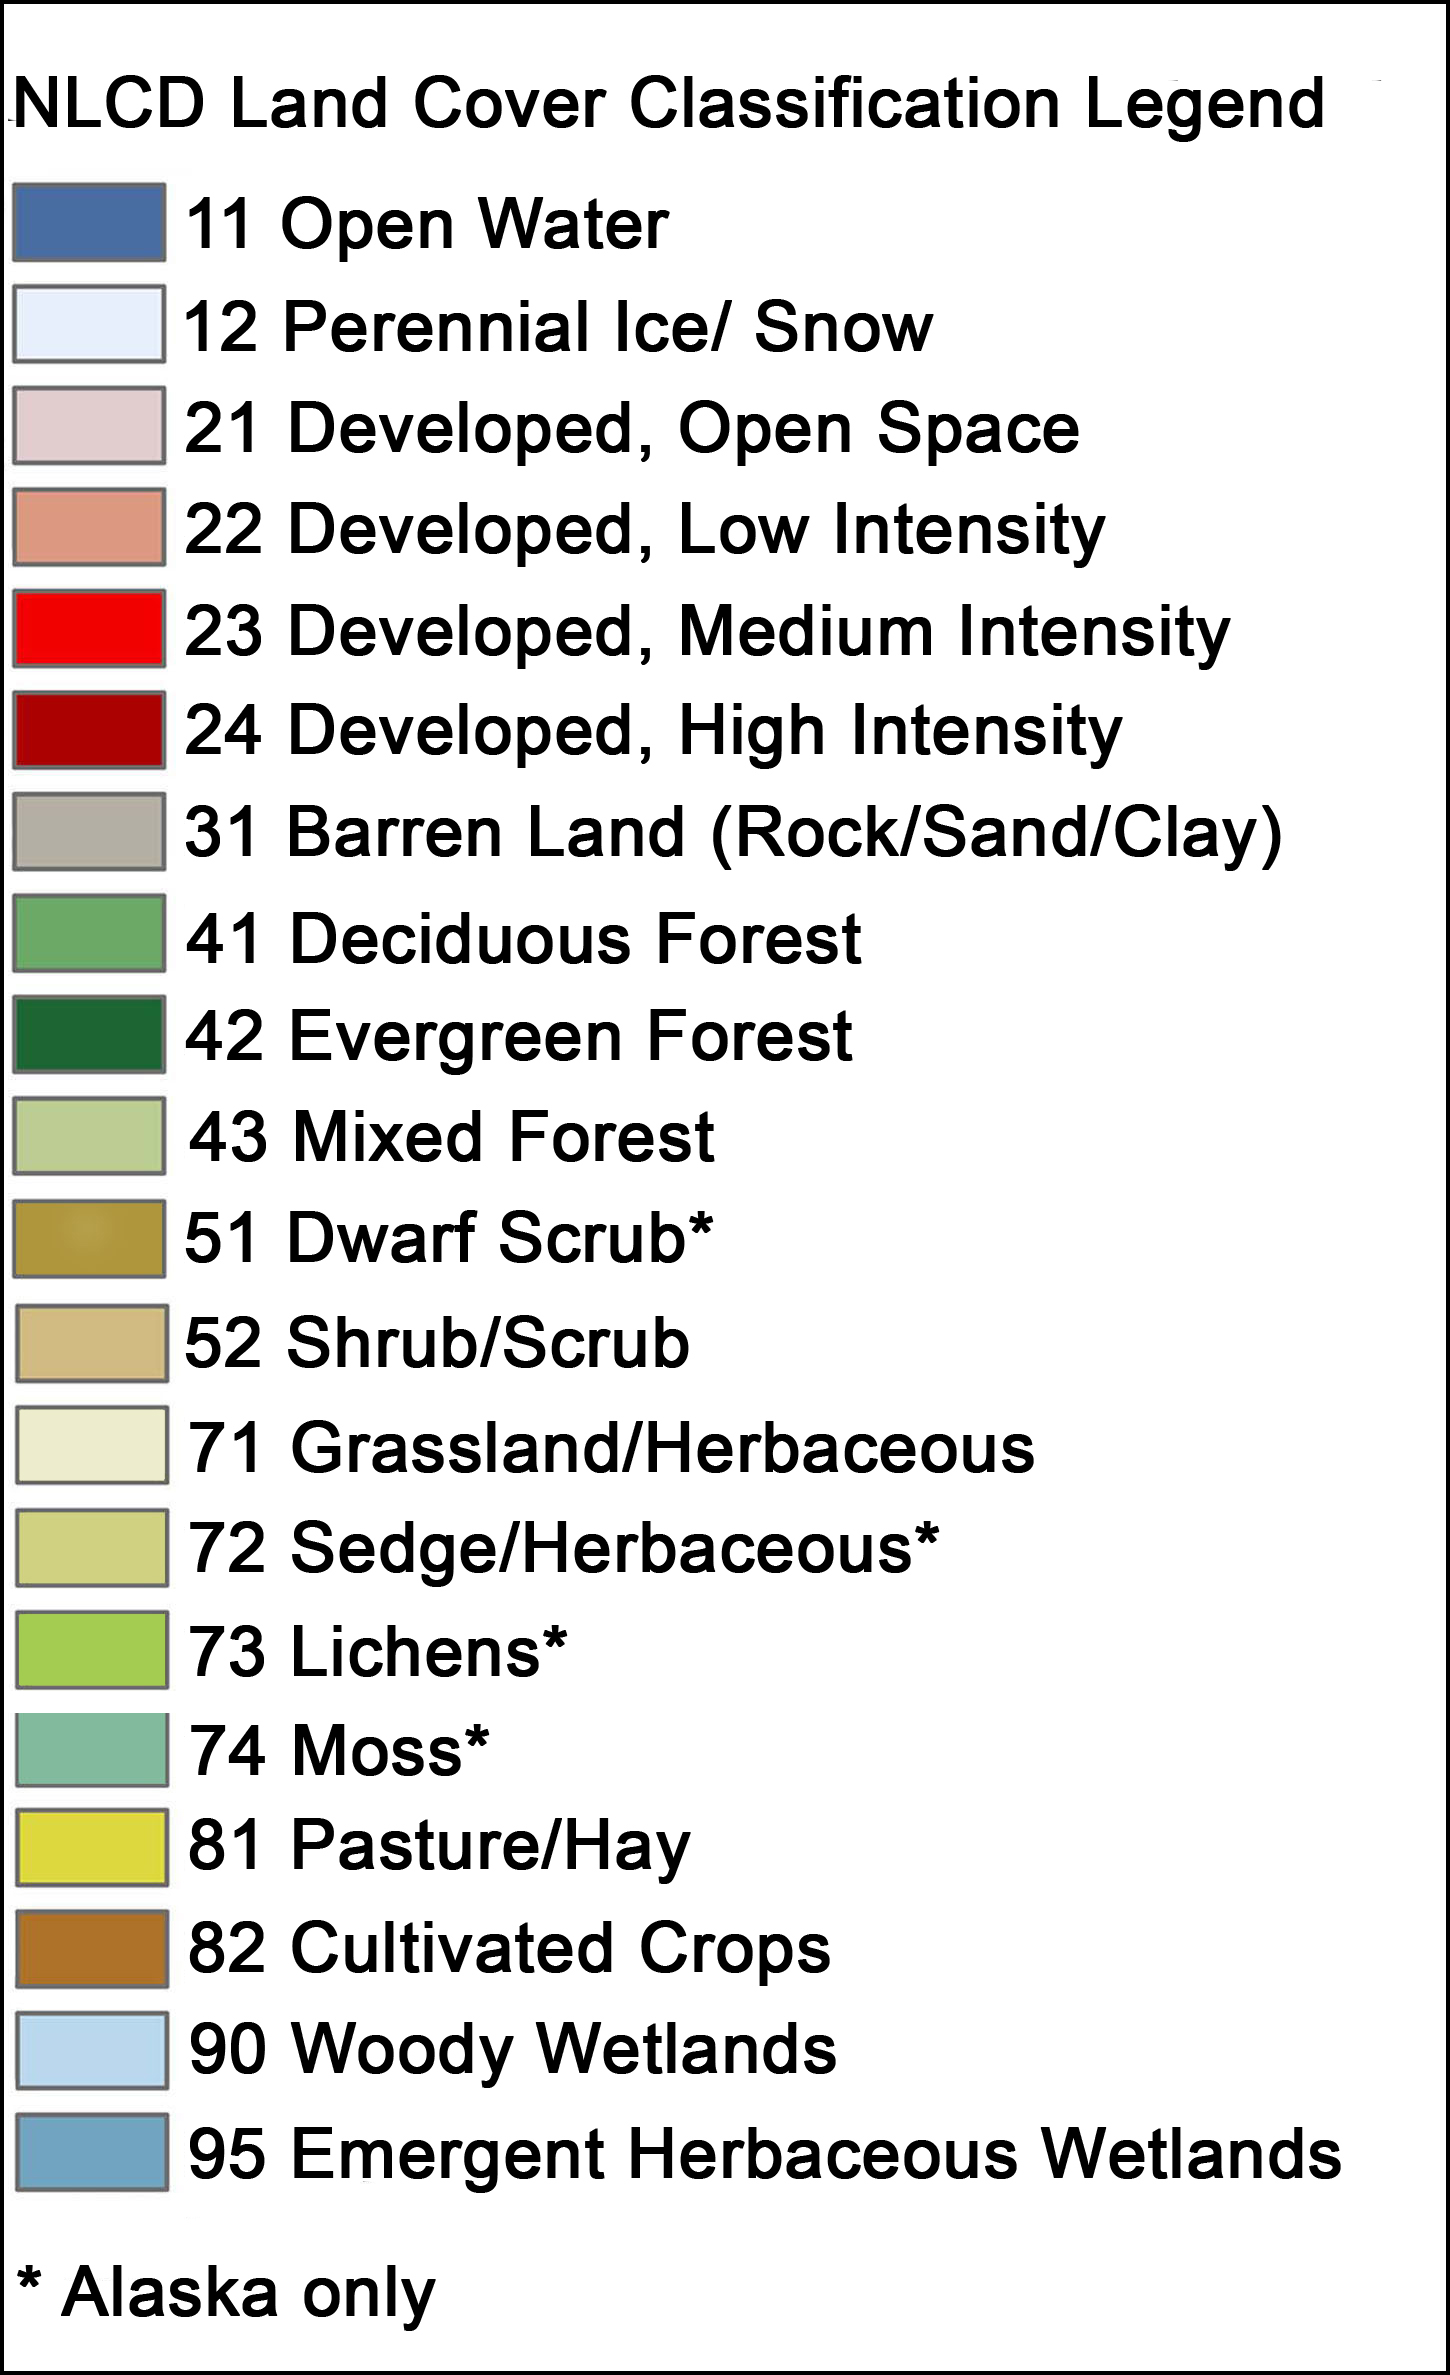
d) Identify the land cover classes of three random grid cells. The following table is provided as a reference.
e) How many grid cells are classified as Developed, High Intensity, Cultivated Crops, and Open Water?
Task 2 (5 points)#
a) How many different land cover classes are there in the 2001 data?
b) Aggregate all developed land cover classes (i.e. 21, 22, 23, and 24) into a single class.
c) What percentage of the 2001 data is occupied by this new developed class?
d) What percentage of the 2001 data is occupied by open water?
e) Which is the most common land cover class in the 2001 data (as a percentage)?
Task 3 (5 points)#
a) Import the
nlcd_2019_phoenix.tifGeoTIFF and aggregate all developed land cover classes (i.e. 21, 22, 23, and 24) into a single class.b) How much did the developed land cover class change by between 2001 and 2019 (as a percentage)?
c) How much land was developed between 2001 and 2019 in km\(^2\)? Remember that each pixel is 30 x 30m.
d) How did the cultivate crops class change between 2001 and 2019 (as a percentage and in km\(^2\))?
e) Make a DataFrame showing land cover change (as percentage) for all classes.
Task 4 (5 points)#
Make a figure that replicates panels b (or d) from Figure 2 of van Vliet (2019), but for Phoenix.
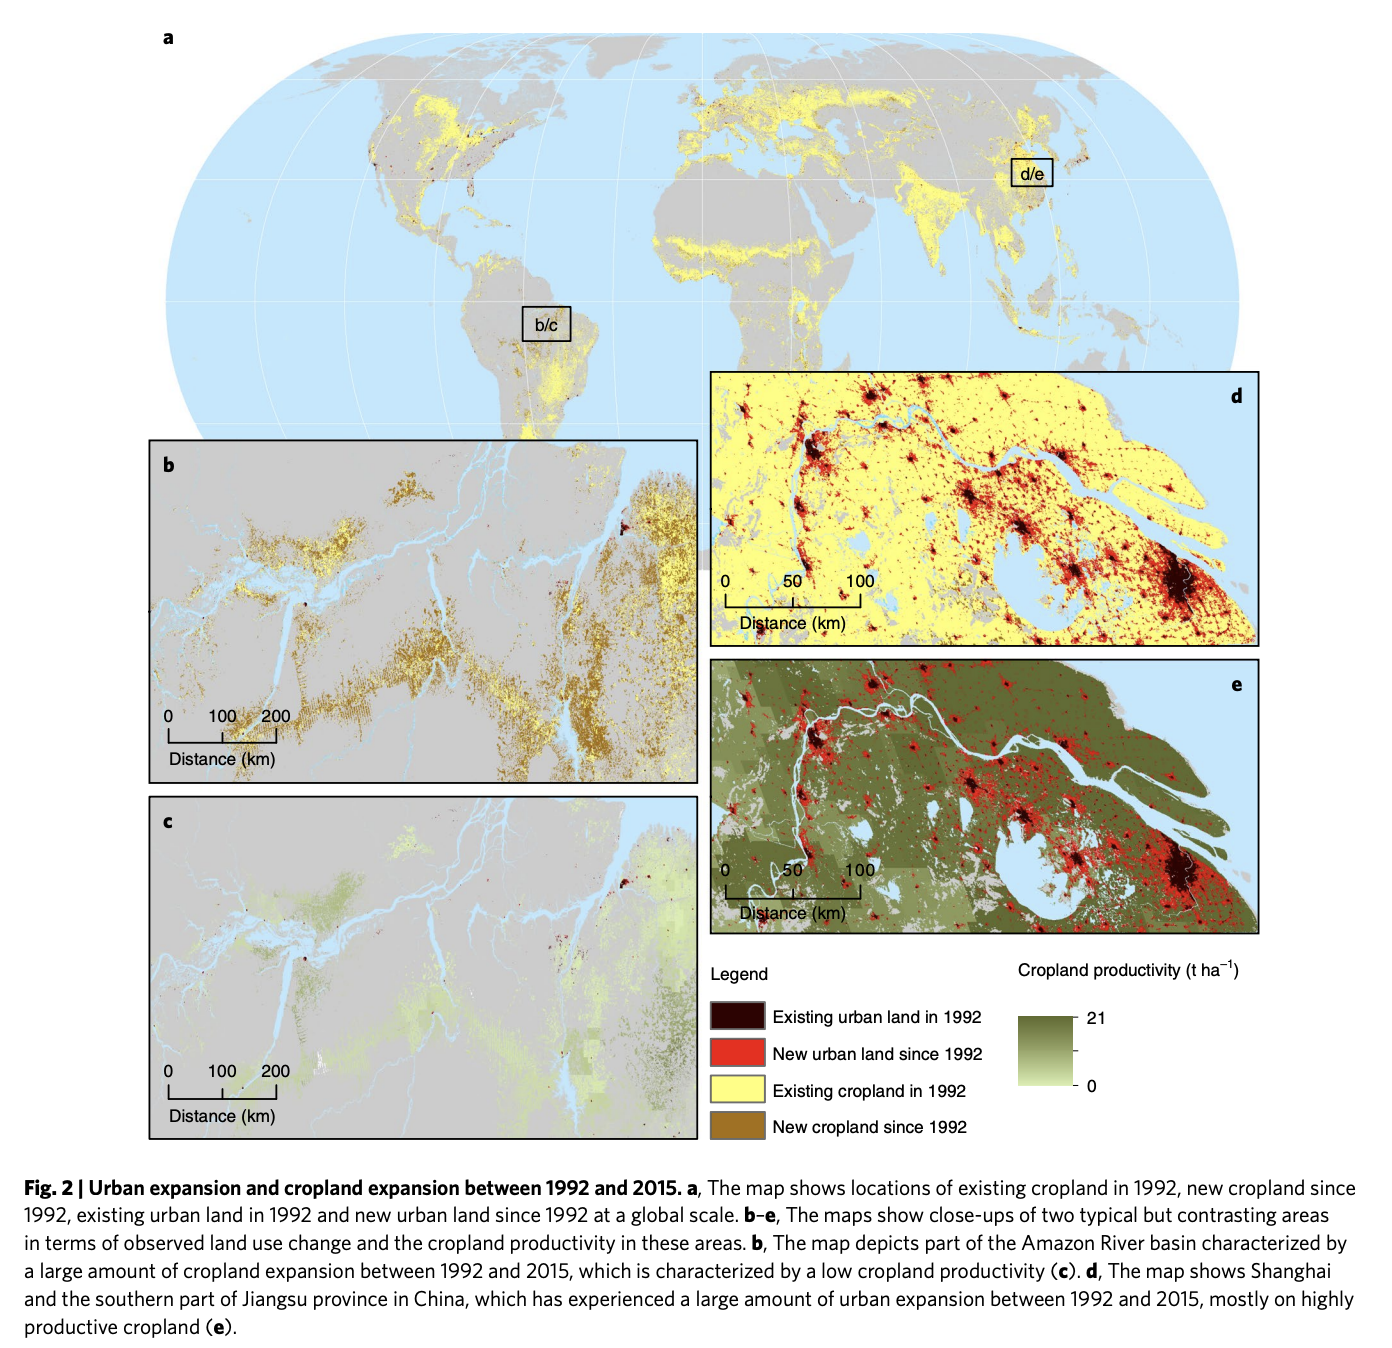
The figure is from van Vliet, J. (2019). Direct and indirect loss of natural area from urban expansion. Nature Sustainability, 2(8), 755-763.
In the second part of this assignment we will be anlyzing some climate data for the US in 2021. Download the data for the assignment from here. The dataset contains gridded daily air temperature (K) and cloud cover (%) over the USA for 2021. t2m stands for 2 m above the surface, the standard height used by temperature sensors. It is a common metric used in climatology but note that it is different from the surface temperature which would be the temperature of the ground surface.

Task 5 (5 points)#
Read the US climate data and answer the following questions:
a) What are the dimensions of the dataset?
b) List the northernmost, southernmost, eastermost, and westernmost coordinates of the dataset.
c) What was the mean air temperature (in F) and cloud cover (in %) of Eugene?
Click to reveal hint
Right-click on Google Maps to record the approximate latitude and longitude of Eugene.
d) What day was the hottest and coldest in Eugene?
e) What day was the hottest and coldest in Florence, OR?
Task 6 (5 points)#
Find the following grid cells in the US climate data and provide the lat/lons and a rough location of where they are located.
a) Highest annual mean air temperature (i.e. hottest place)
b) Lowest annual mean air temperature (i.e. coldest place)
c) Highest annual mean cloudiness (i.e. cloudiest place)
d) Lowest annual mean cloudiest (i.e. least cloudy place)
e) Highest range in air temperature
Note
Copy and paste the lat/lons into Google Maps to find the location of these places.
Task 7 (5 points)#
a) What was the mean air temperature (in F) and cloud cover (in %) in Florence, OR in February?
b) What was the air temperature (in F) and cloud cover (in %) in Phoenix, AZ on July 16?
c) What was the mean air temperature (in F) and cloud cover (in %) in San Francisco, CA in Summer (i.e. Jun, Jul, and Aug)?
d) What was the mean air temperature (in F) and cloud cover (in %) in Bozeman, MT between Dec 16 and 24?
e) What was the mean air temperature (in F) and cloud cover (in %) in Las Vegas, NV in Fall (i.e. Oct, Sep, Nov)?
Important
Save your notebooks locally as both .ipynb and .pdf formats but only submit the pdf to Canvas.