Assignment 2#
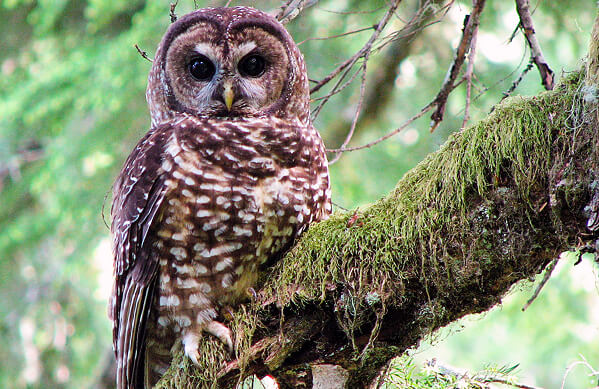
Download the data for the assignment from here. The first dataset contains wildfire perimeters for Oregon from the National Interagency Fire Center. The first second contains the centers of activity of all known Northern Spotted Owls breeding pairs in Western Oregon as determined by the Bureau of Land Management. More information can be found here.

Task 0 (0 points)#
Activate the
.gdsPython environment by opening an Anaconda Prompt (miniconda3) (Windows) or Terminal (macOS). Then, on Windows:
.gds\Scripts\activate
Or, on macOS:
source .gds/bin/activate
Note
Make sure you run this command from the same directory as the .gds environment folder.
Open a Jupyter Notebook by running:
jupyter notebook
Note
If you run this command from your course folder, your .ipynb assignment will automatically be saved there.
Task 1 (5 points)#
Import GeoPandas, read the wildfire dataset, and answer the following questions:
a) How many rows and columns are there?
b) How many wildfires occurred in 2021?
Click to reveal hint
Remember the syntax for masking is df[df['column'] == value].
c) Reproject the dataset to UTM Zone 10N (EPSG:32610) and make a new column called
areathat contains the area of each wildfire.d) What are the names and years of the five largest wildfires?
e) What was the total area (in km\(^2\)) of wildfire in 2021?
Note
The units of the area column are m\(^2\) by default.
Task 2 (5 points)#
Read the spotted owls dataset and answer the following questions:
a) How many rows and columns are there?
b) What is the min/max values in the
malesandfemalescolumns?c) What percentage of locations have female spotted owls?
d) What is the furthest east that spotted owls have been identified?
Reproject the dataset to UTM Zone 10N (EPSG:32610).
e) Make a new column called
pairswhich has a value of1if there are both male and female owls in that location.
Task 3 (5 points)#
a) How many owl pairs were affected by wildfires?
Click to reveal hint
Merge the two datasets using a spatial join. Depending on how you do it, there will be rows with NaN values. These are wildfires that don’t overlap with owls (or owls that don’t overlap with wildfires). Before computing stats, we recommend removing these using the .dropna() method.
b) In which year were most owl pairs affected by wildfires?
Click to reveal hint
The .groupby method will be very useful here.
c) How many owl pairs were affected in this year?
d) Provide the name and year of the wildfire that affected the most owl pairs (disregard wildfires named
Unknown)?e) Make a plot showing locations of Northern Spotted Owls breeding pairs on top of the wildfire perimeters for Oregon.
Important
Save your notebooks locally as both .ipynb and .pdf formats but only submit the pdf to Canvas.
